Squarespace Analytics Explained

Getting started with Squarespace? Sign up for a free trial here and use the code PARTNER10 for 10% off your first year (Yep, that's an affiliate link!)
You have a website and you’re trying to grow your audience and spread your influence. But how do you know if you are making an impact?
When it comes to growing your Squarespace website, the analytics panel should be your new best friend!
Tracking your website statistics is a great habit to get into as early as possible. There is so much information with the Squarespace Analytics panel that allows you to learn about your audience and improve your content, and what better way to know if your website is growing than by seeing the numbers that show it?
Do you know who is visiting your website and what they are doing on there? If not, I’ll walk you through Squarespace Analytics to show you how to understand the information so you can learn more about your audience, your website’s trends and what is and isn’t working for you.
This post is part 1 in a 2 part series. You can read part 2 here
Accessing Squarespace Analytics
When you are logged into your Squarespace account, you can access Analytics from your home screen, and once you’ve clicked in, you will see a menu of statistics you can check.

Don’t worry, I know it looks overwhelming when you first click in, but I’ll take you through each section so you’ll be a Squarespace Analytics pro by the end!
Understanding Squarespace Analytics
Note: All screenshots in this post are from a separate website not www.jessicahainesdesign.com
Traffic
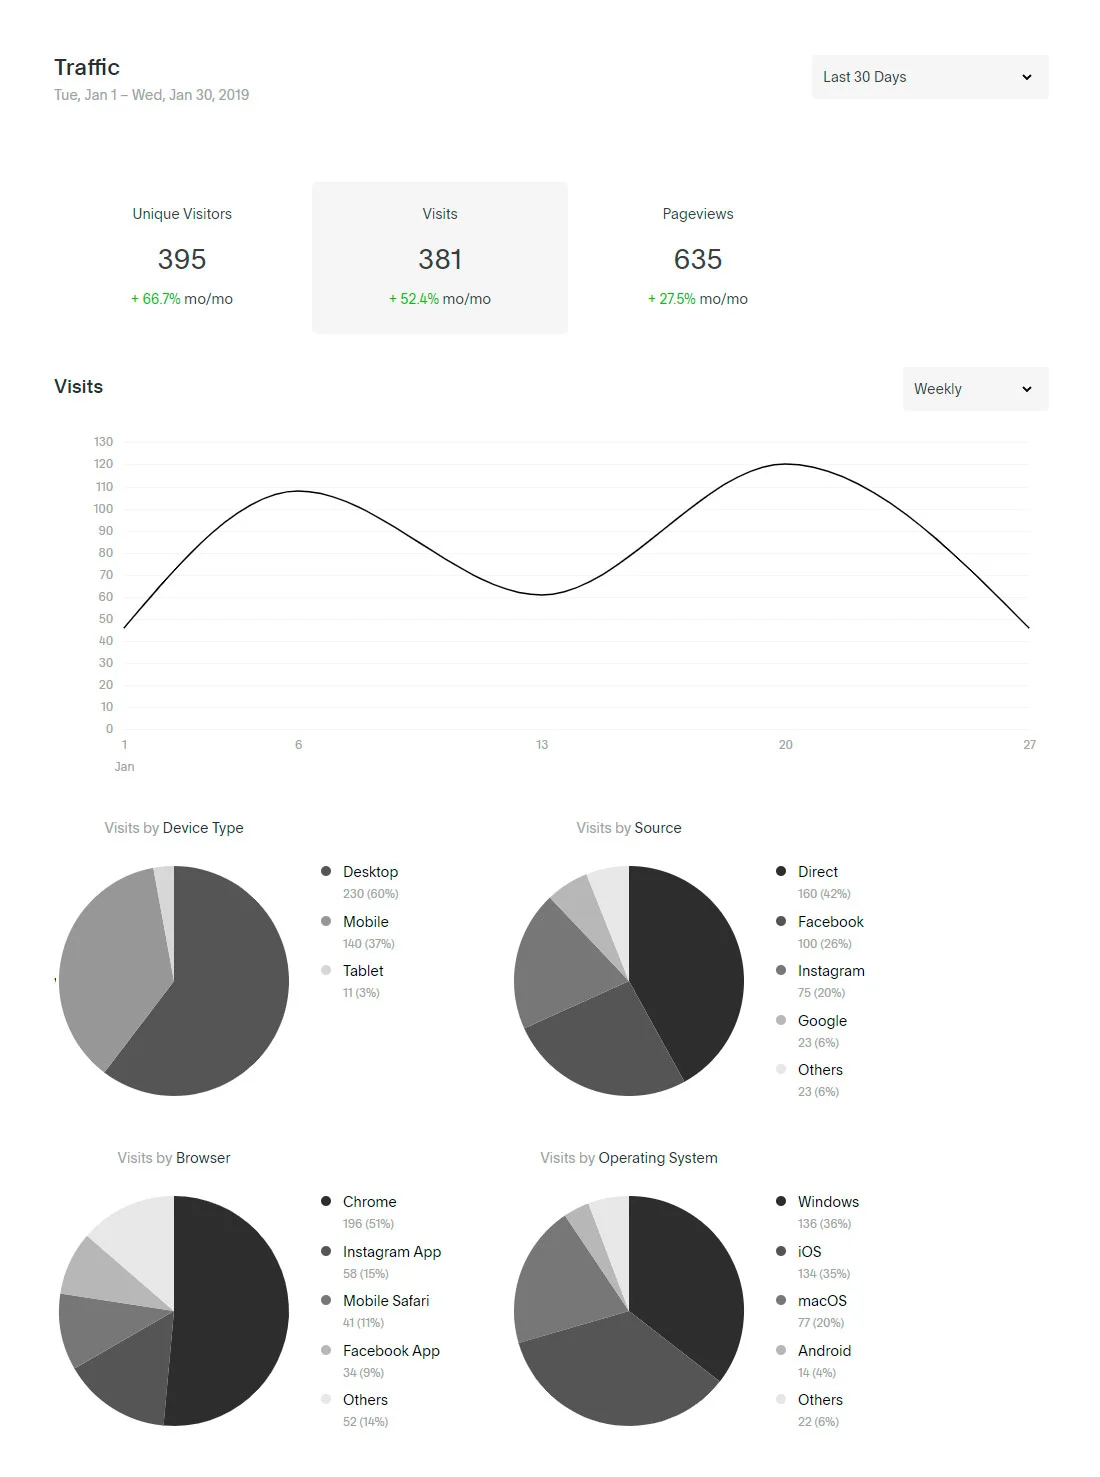
When you first click in to your analytics, you will start on the “Traffic” page. This page gives you an overview of the traffic your website receives, page views, audience size, and where your traffic is coming from.
From here, you can see the date range that is set under the title, or you can change it in the top right corner if you want to check results for a certain period. This will show on every analytics page and can be changed the same way.
The next section that displays is the number of unique visitors that have come to your website during the period, the number of individual visits to your website, and the number of individual pageviews during the period.
A Unique Visitor is an estimate of the total number of actual visitors you have had come to your website over the time period. This is tracked through browser cookies, so if a viewer visits from different devices, clears their cookies or uses a different browser (eg Google Chrome then Safari), then they will be counted for each visit. Unique Visitors is a great way to see your loyal audience on your website
A Visit is a single browsing session that could be made up of multiple different pageviews. This it tracked in 30 minute intervals, so if your viewer clicks on 5 pages in that time, it will count as one pageview, whereas if they leave your website and head back after 30 minutes, it will count as another pageview. Visits are a good measure of how much attention your website is getting
Pageviews track how many actual pages have been visited on your website in the time period, so will update to reflect if someone has loaded multiple pages
Directly below these figures you will also see the percentage the item has grown month-to-month in green, or the percentage it has reduced by in red if the numbers have gone down during the time period.
Clicking on any of these options will change the graph below to reflect the result visually. This graph can be set to show the results daily, weekly, monthly or yearly depending on the date range you have loaded, so you can see how the performance has gone throughout the period. Hovering over one of the dates on the graph will show the result for that specific day as well.
When you scroll further down the page, you will see some pie charts that show the number of visits by device type, source, browser and operating system, along with what percentage of visits this works out to be.
Device Type: This shows how many viewers visit your website from desktop, mobile or tablet. This will give you more insight into what platform you should prioritize when designing your website. For example, if you know most of your visitors are from mobile, then you know you need to make sure your mobile design looks and functions well, even if something may look a little funny on the desktop version
Source: This shows where your traffic is coming from. Direct would be how many viewers are actually typing in your website, then you will see how many viewers are coming to your website from social media. You will also see how many viewers are finding your website from a Google search, email campaign or another source. This information can help you prioritize your marketing by focusing on what you are already doing well, or trying to grow the areas that you are not doing so well with
Browser: This shows you what internet browser your viewer is going to your website from. Knowing this will allow you to test your website on the browsers that your audience uses, to make sure it looks and works the way you want it to for the majority of your viewers
Operating System: This shows what operating systems are being used when viewing your website. As above, knowing what your viewers are using to view your website will allow you to test your website on those devices to ensure everything looks and functions as it should
Geography
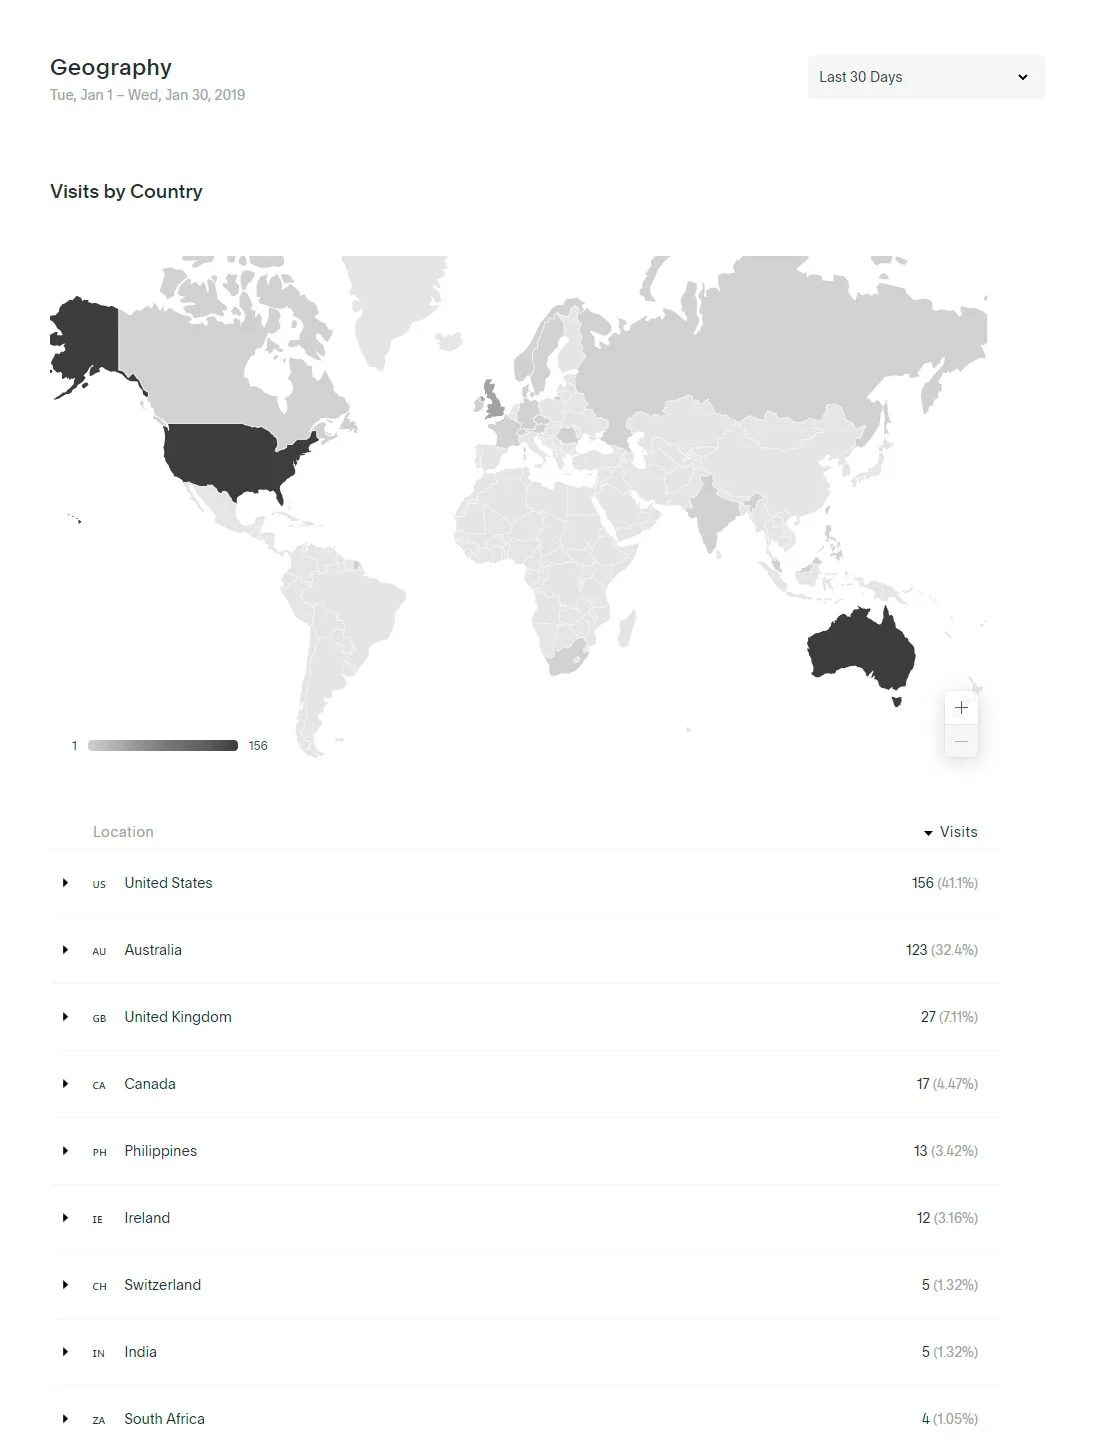
Geography Analytics show where your visitors are coming from by location.
You will see a heat map at the top of the page that lets you visually see where your visitors are coming from. The darker the shade of a place, the more visitors you receive from that particular location. You can also hover over a specific place on the map to see the number of visits from that area. Clicking on a country allows you to zoom in further on the map so you will be able to see regions, and clicking on a region will zoom in again to see which cities your viewers are coming from.
Below the map, you will see a table of the countries with the number of visits and what percentage of visits this works out to be. You can also click on the country to show the results by region, and then click again to view by city.
Knowing this information can let you know where you have the most visitors and potential customers coming from, where you should focus your marketing efforts such as Google or Facebook ads, if you need to consider foreign languages on your website and how your website’s reach is growing.
Traffic Sources
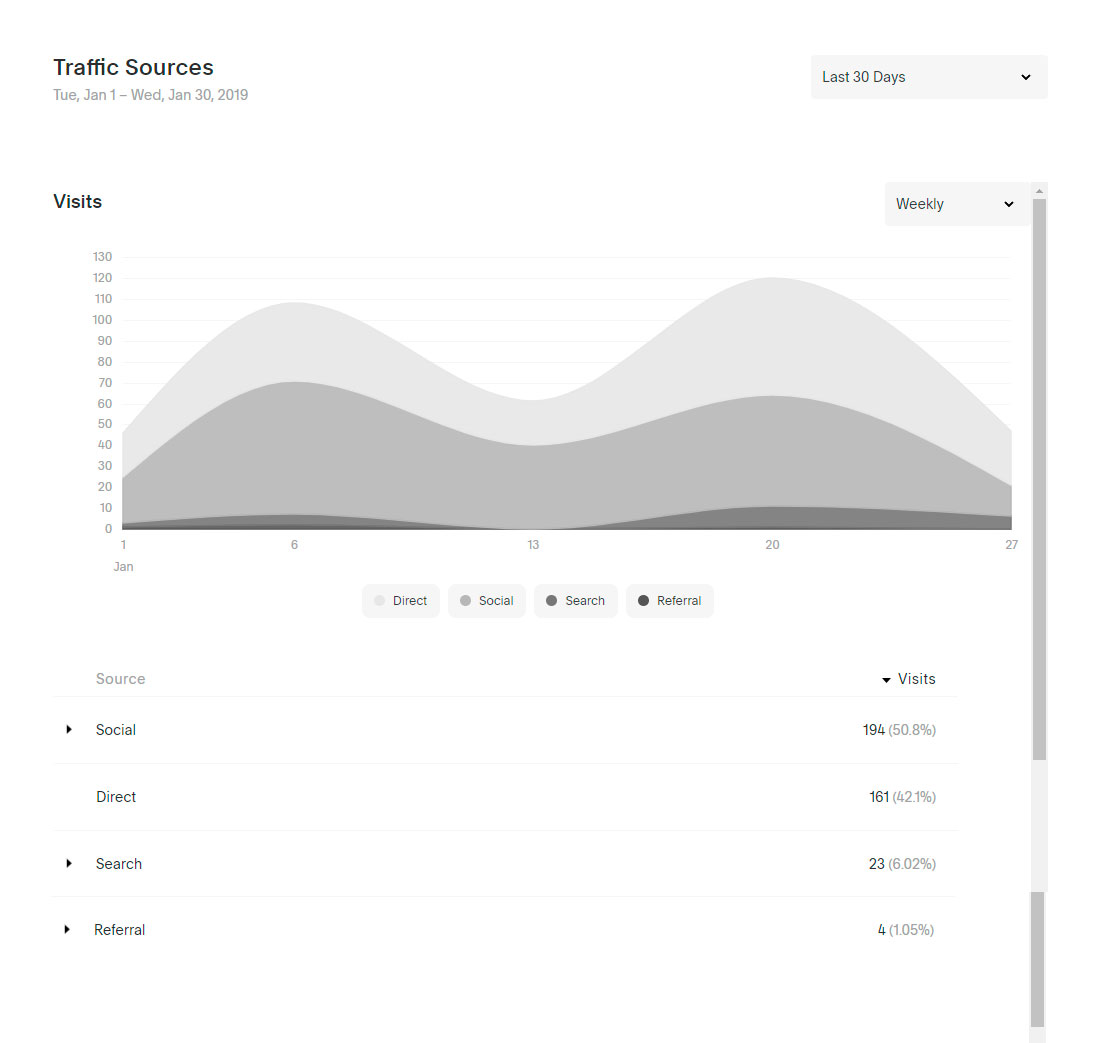
When you head into the Traffic Sources panel in your analytics, you will see where the visitors to your website are coming from and which referral sources are the most beneficial for your business.
You will see a graph at the top that shows colored sections for different type of traffic to your website, and you can hover over a particular day to see the stats specific for that day.
Direct Traffic is when someone has typed your website address directly into their browser rather than clicking through from elsewhere. This can sometimes appear high if you have been visiting your own website without logging in
Display Ads is when traffic comes to your website from display ads on other sites
Email is when someone visits your website from an email marketing campaign. You will be able to see the results from Squarespace email campaigns or MailChimp if you have the E-commerce link tracking ticked in the MailChimp campaign
Search is when someone has completed a search in any search engine and clicked through to your website
Social is when traffic has come through to your website from one a social network like Facebook, Twitter, Instagram, Pinterest, LinkedIn, or YouTube
Paid Search is when you have paid to show up in searches in Google or other search engines
Referral is when someone comes to your website from any other website or blog that doesn’t fit in the above categories
The table below the graph will list all sources of traffic that have come to your website, including the number of visitors and the percentage of visits. You can click on each one that has an arrow to the left to see a more specific breakdown of where the traffic has come from as well, for example Social may show your traffic is from Pinterest, Instagram and Facebook.
Knowing where your website traffic is coming from will help you to see which sources are sending you the most visitors so you can plan your marketing strategy to focusing on what is working, or building up a platform that has been struggling. For example, if you are testing a new marketing effort, you can see how it is working, or you can assess where it would be good value to invest more in ads or time.
Note: If you have a commerce plan, you may see additional information on this page. To understand the additional categories, you can find out more in this Squarespace article.
Google Search Keywords

If you want to know what search terms are sending viewers to your website, you want to look here. This page will show you what search keywords are sending people to your website from Google, and the average position your website ranks for different search words.
To be able to see your search keywords, you will need to verify your website with Google Search Console first. Once you have done this, it can take up to 72 hours for your Google Search Keywords panel to start showing in your analytics.
This page will show the results for Clicks, Impressions, Click Rate and Avg. Position across the top of the page with the growth listed below.
Clicks: The number of people that clicked through to your website for a certain search term
Impressions: The number of people that saw your website in a search for a certain search term, even if they didn’t click through to your website
Click Rate: The percentage of impressions versus clicks. This is calculated as (Clicks / Impressions) x 100
Avg. Position: How well your website ranks for the search term on average, so if you show in 5 search results varying from 1st to 5th position, you would show the average position of 3
You can click on any of these items to load a graph of the results below. This graph will show the search results over the time period for the top 4 keywords from that period. As with the other graphs, you can hover over it to see the results for a specific day.
The table below the graph shows all of the search terms from the time period. This is where you will be able to see the search keyword each of the 4 categories. You will also see the percentage of clicks that lead to your website.
In some cases you may see Others listed at the bottom. This is where Google hasn’t provided a result for security reasons because the keyword is only used by a small number of people.
By knowing what terms peoples are searching to find your website, you can focus the content you are producing to match the terms people are searching, since it allows you to see the language people naturally use, which will help you connect to your viewers better.
Other Search Keywords
This page will show the search keywords that have driven traffic to your website from other search engines like Bing or Yahoo.
This page shows a little differently to the Google Search Keywords. It has a bar graph that shows the search keywords from the time period you have set across the bottom, with the number of clicks above.
The table below these results will show any additional terms that don’t fit along the graph. If there is an arrow to the left of the search term, it means there have been multiple searches related to that keyword, so you can click the arrow to see the list of URL’s that were clicked to.
Some search engines hide the search terms from third party services like Squarespace, and this shows as Not Provided in the results.
I know analytics can seem overwhelming or boring compared to other business tasks you may do, but it’s such an important step in knowing how your website is going and to help you improve the content you are sharing, so adding this to your monthly admin tasks can really help you take your business growth to the next level!
You can read part 2 of the Squarespace Analytics series here.
Looking for help to launch a website you love?


